import matplotlib.pyplot as plt
import seaborn as sns

tips=sns.load_dataset("tips")
g=sns.FacetGrid(
    data=tips,col='sex',row="time",hue="smoker",
    margin_titles=True,palette={"Yes":"g","No":"r"},
    hue_kws={"marker":["v","^"]}
)
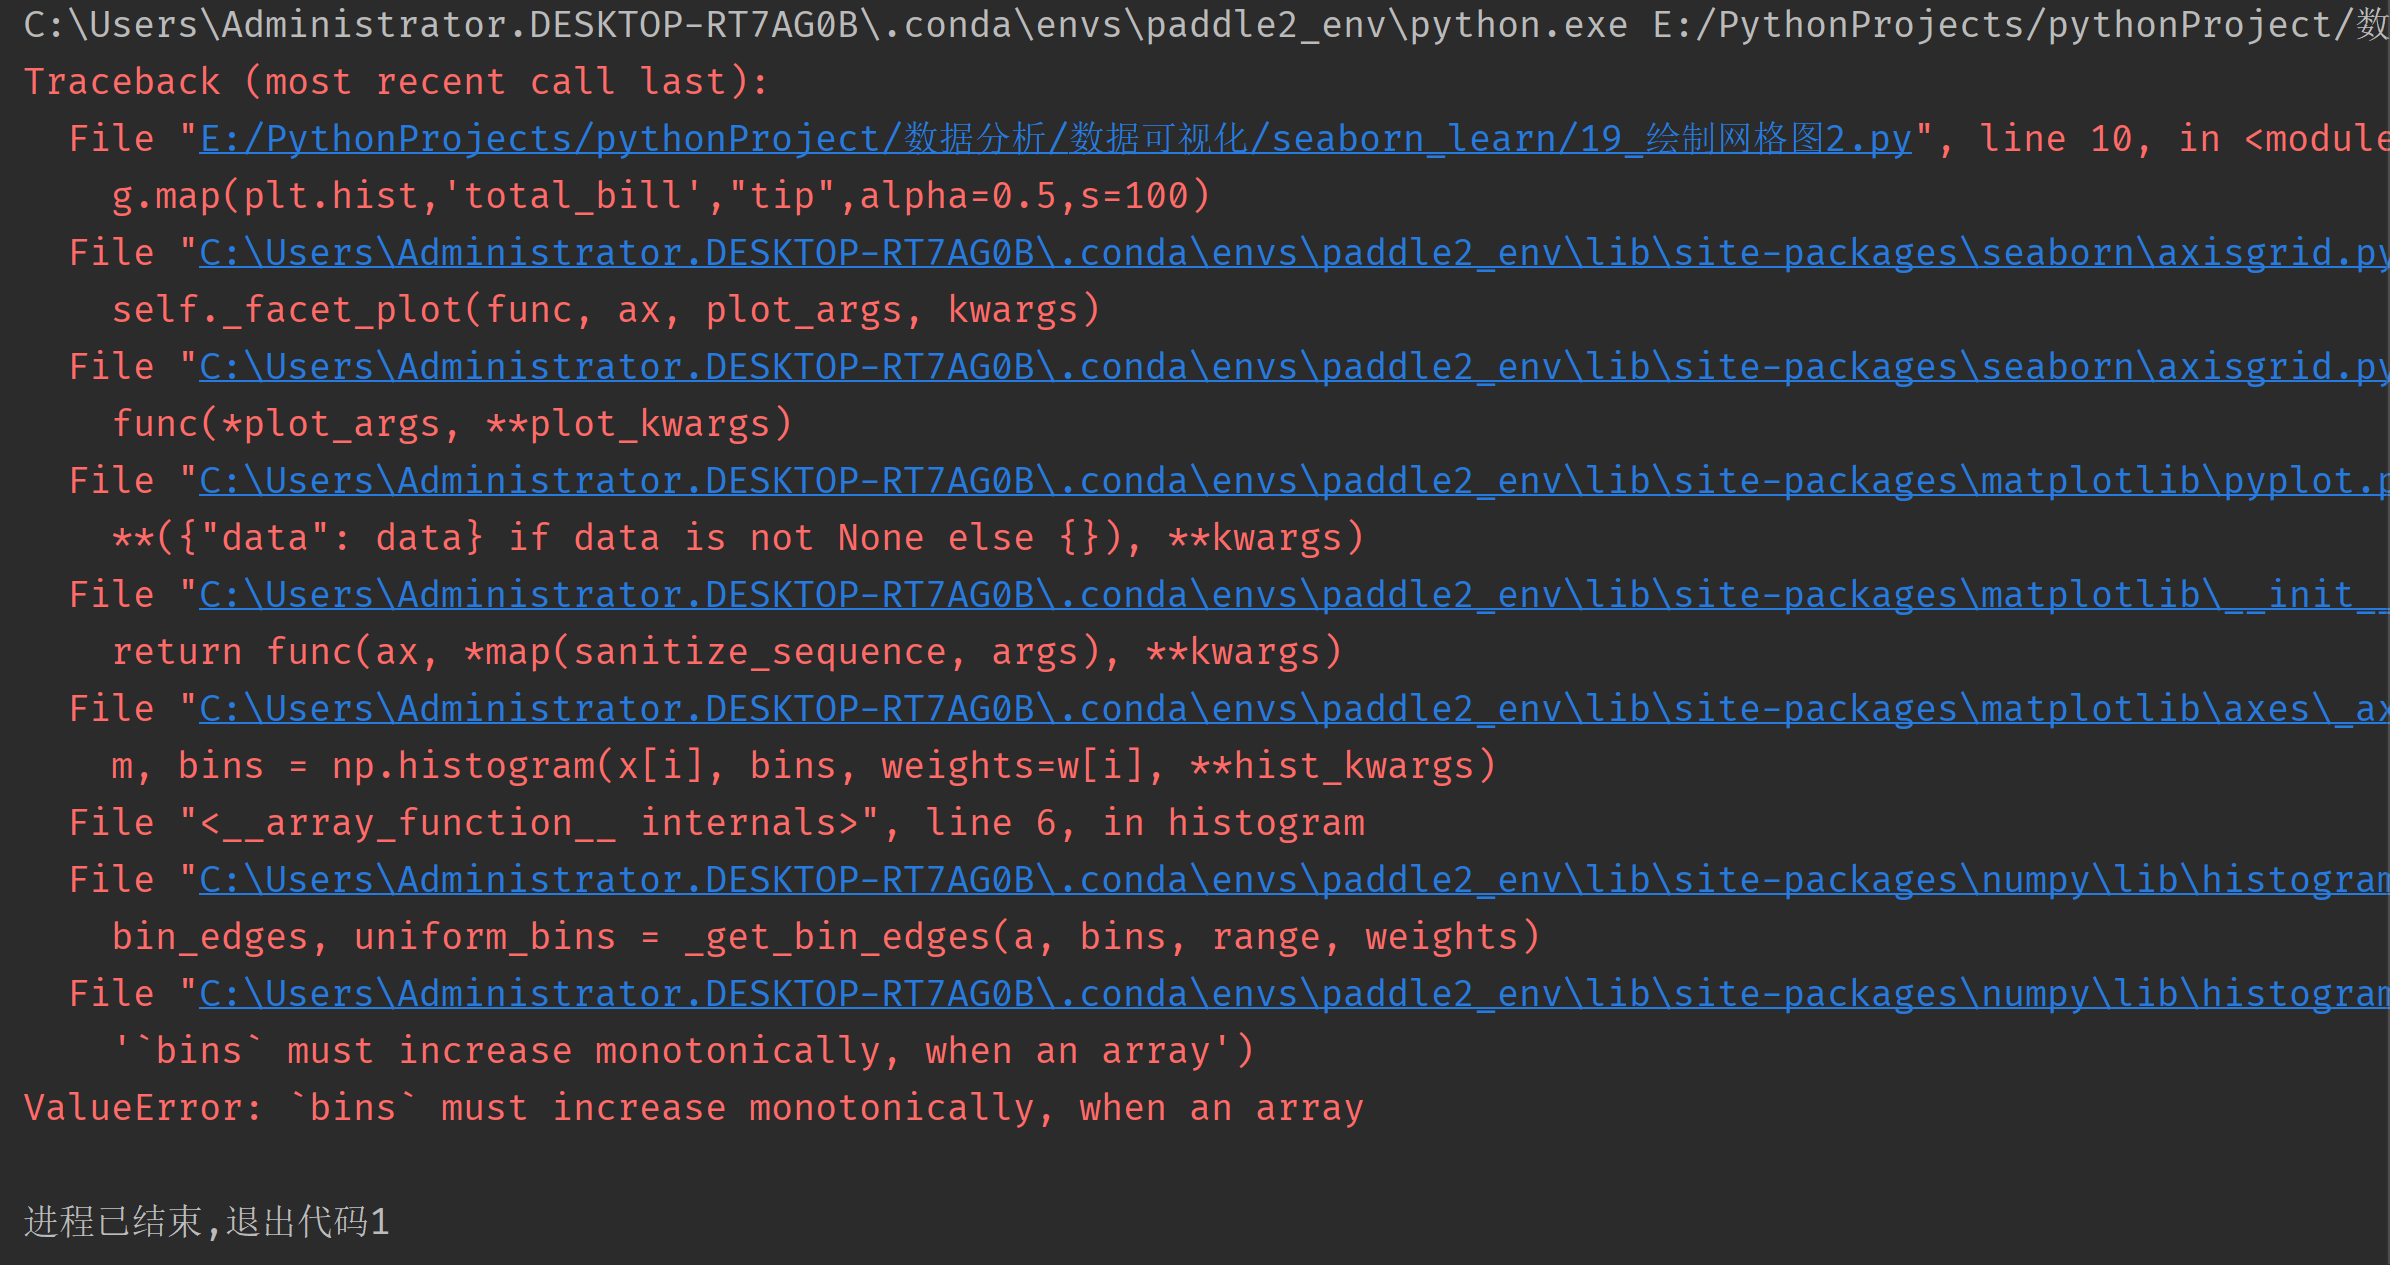
g.map(plt.hist,'total_bill',"tip",alpha=0.5,s=100)
plt.show()
代码报错是这样的:

问一下老师是怎么回事