
import matplotlib.pyplot as plt
np.random.seed(42)
x1 = np.random.rand(100, 1)
x2 = np.random.rand(100, 1)
# x0=np.ones(100,1)  在Linear Regression已经设置了截距
x_b = np.c_[x1, x2]

y = 5 * x1 + 4 * x2 + 2 + np.random.rand(100, 1)
reg = LinearRegression(fit_intercept=True)

reg.fit(x_b, y)

ic(reg.intercept_, reg.coef_)

# 计算预测值
x_new1 = np.array([[0, 0], [1 ,1] ])

ic(reg.predict(x_new1))
# draw plot
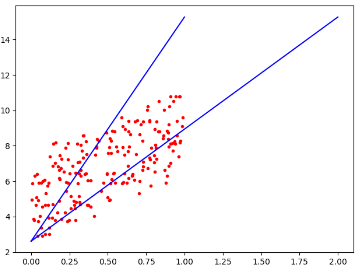
plt.plot(x_b,y,"r.")
plt.plot(x_new1,reg.predict(x_new1),"b")
plt.show()
当改变预测值的输入x_new,则红线变化很大,怎么分析它是否回归,为什么出现两条?